The World Coal Export Market
It's a dirty business. But somebody always decides to do it.
How large is the international coal market?
Have you had a nasty surprise yet today? Here's one for you, just to keep up to your quota.
The reason? Because each carbon molecule in coal combines with two oxygen molecules from the atmosphere during combustion.1
That coal, when used, emitted 3,777,000,000,000 kilograms of CO2. Why are we using kilograms here? Because if you fill a litre bottle with water, that's a kilogram. You know how heavy that is.
How much CO2 is that? Our 3,777,000,000,000 kilograms of CO2 at room temperature and sea level is equal to the weight of about 470 one-litre water bottles for every person on Earth. As a volume of CO2 gas, that's roughly 2 trillion cubic meters.
Mining and transporting all that coal adds roughly 5% to the total CO2 emitted by burning. But we won't count that, because some coal-mining companies say they can reach net zero operations (meaning no CO2 from mining and processing but generally not transport) by 2050. We'll take them at their word. (You shouldn't.)
Who sells and buys coal?
When you study coal-trading patterns (and who would not want to!), you'll discover that available figures don't always agree with each other. In part, this is because some studies rank exporters by the value of the coal traded, whereas others use the tonnage, and yet others go by seaborne volume. If you search "world coal exports by volume" and "world coal exports by dollar value", you'll see a good sampling of articles and methodologies, and you'll see what we mean.
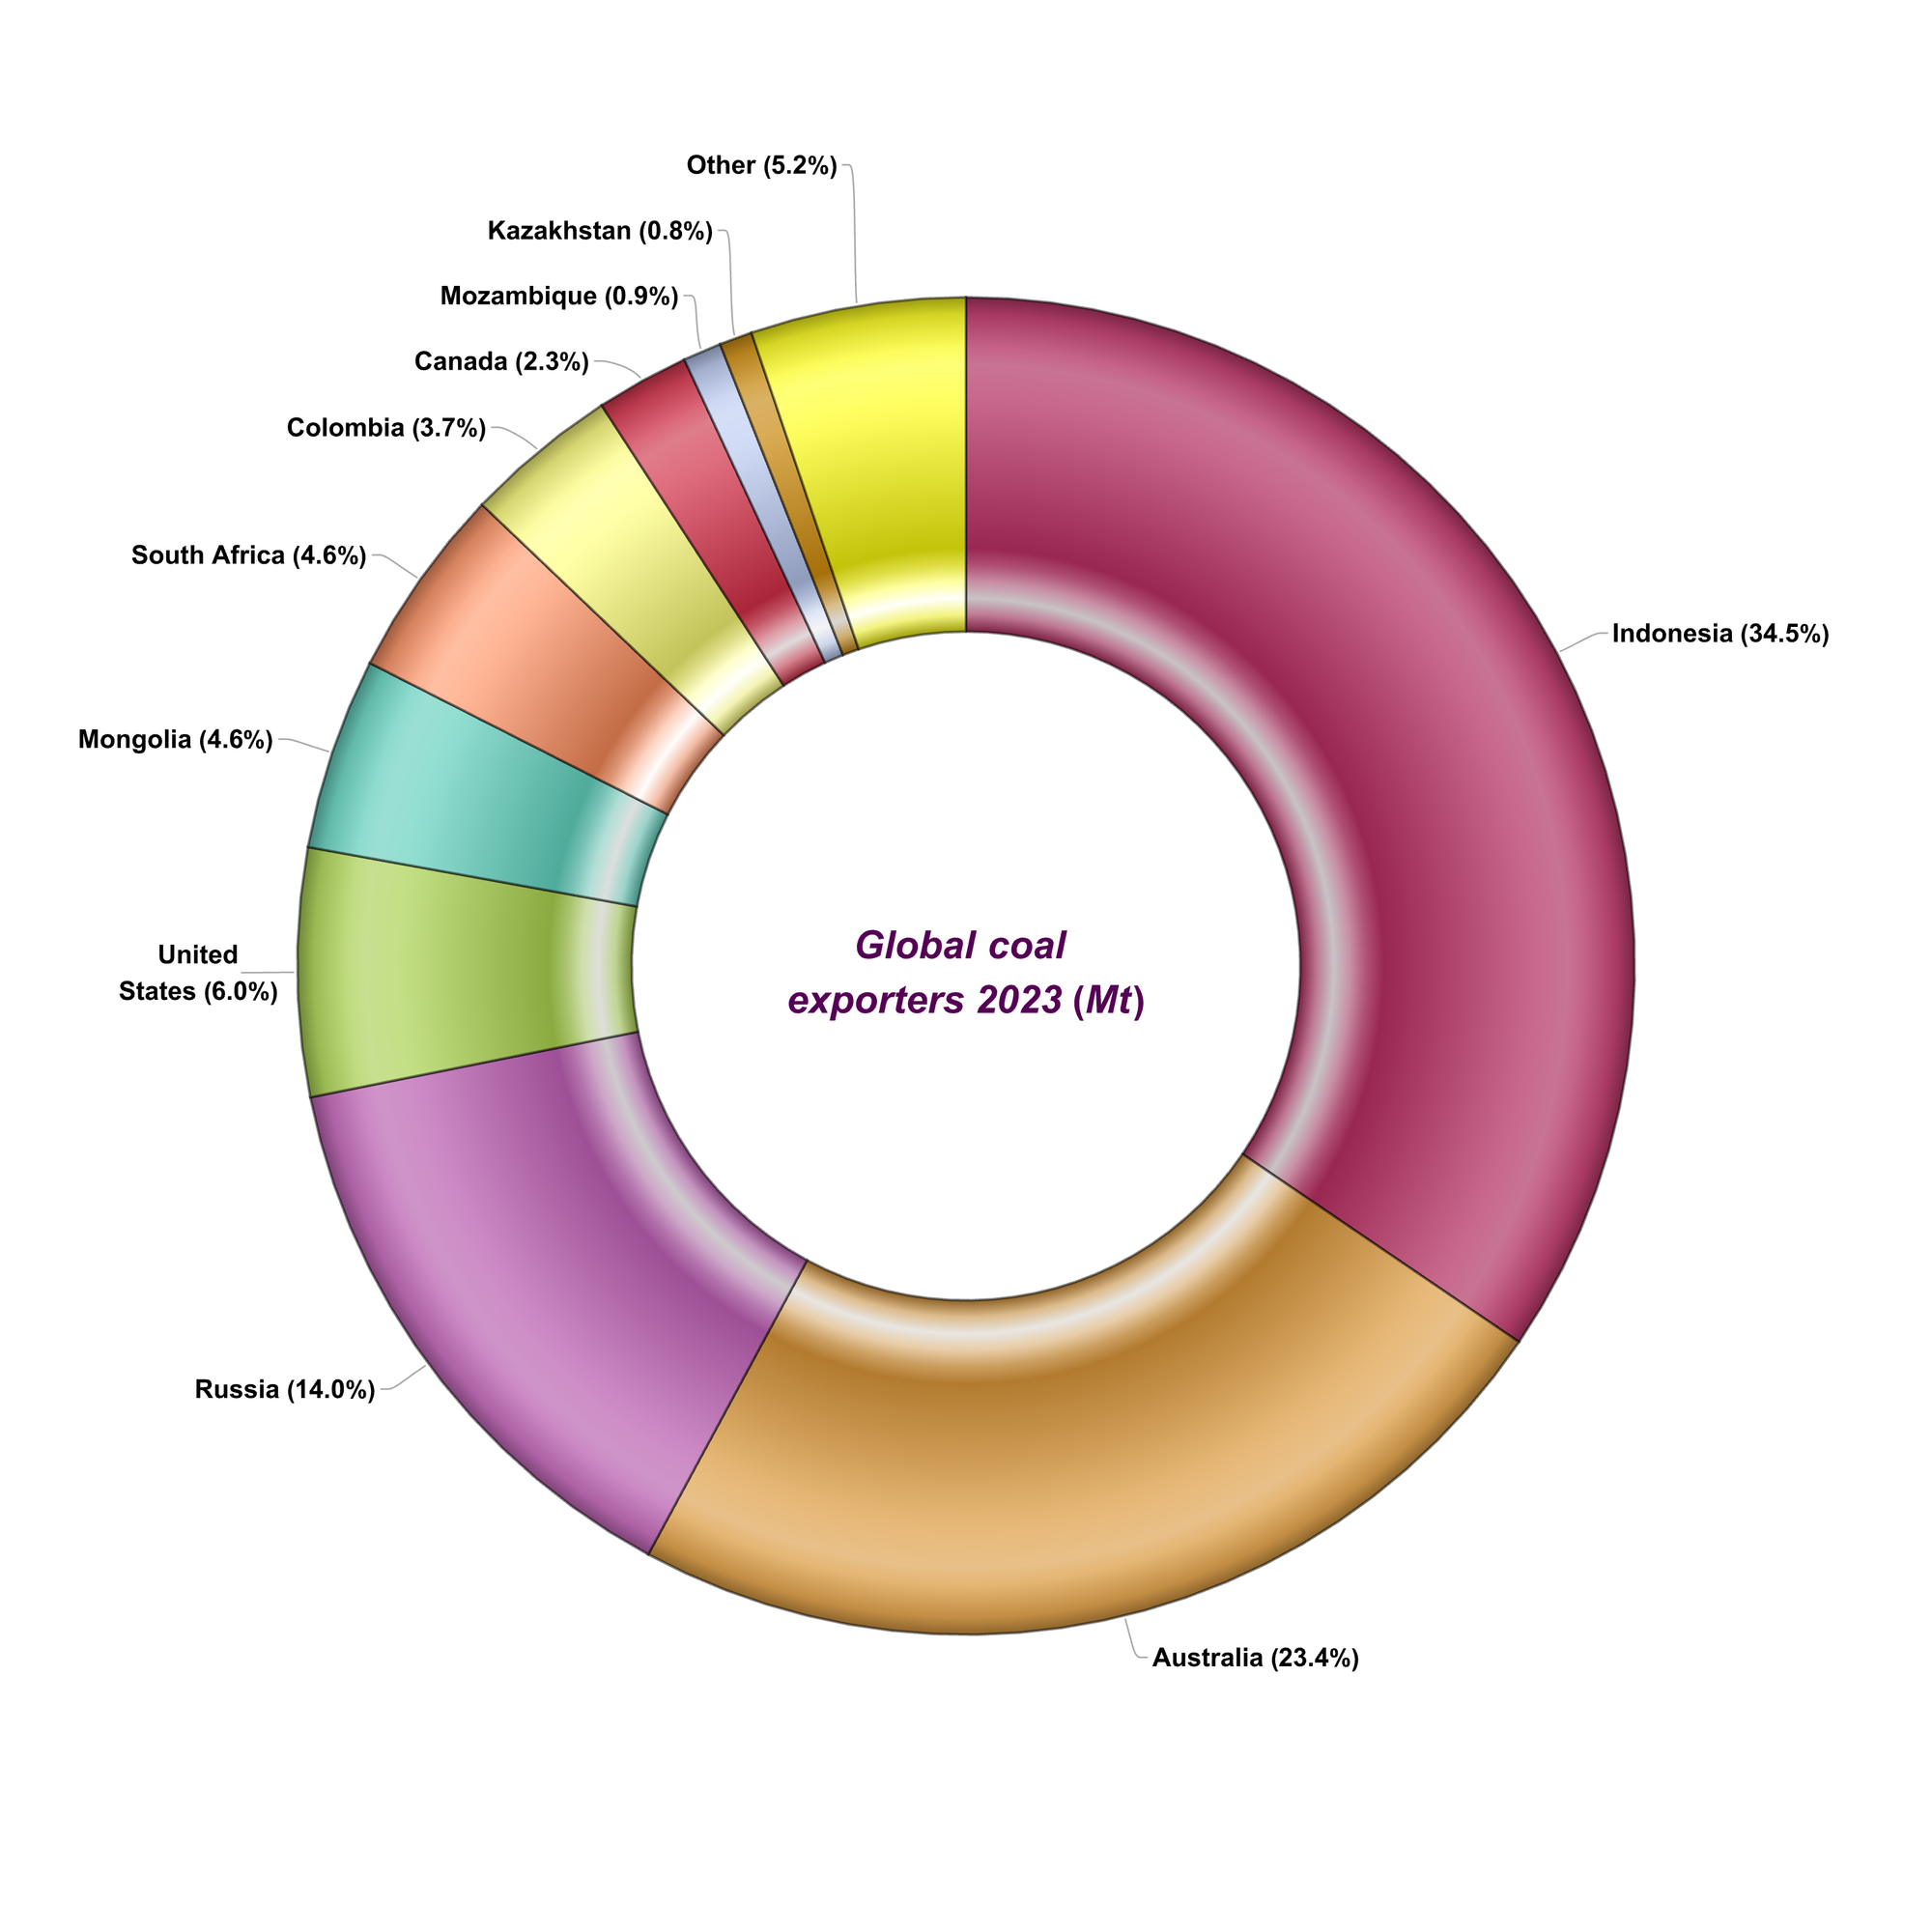
The IEA (International Energy Agency), which is the most-cited source on this topic, lists the world's top coal exporters by shipped tonnage (Figure 1, above).2
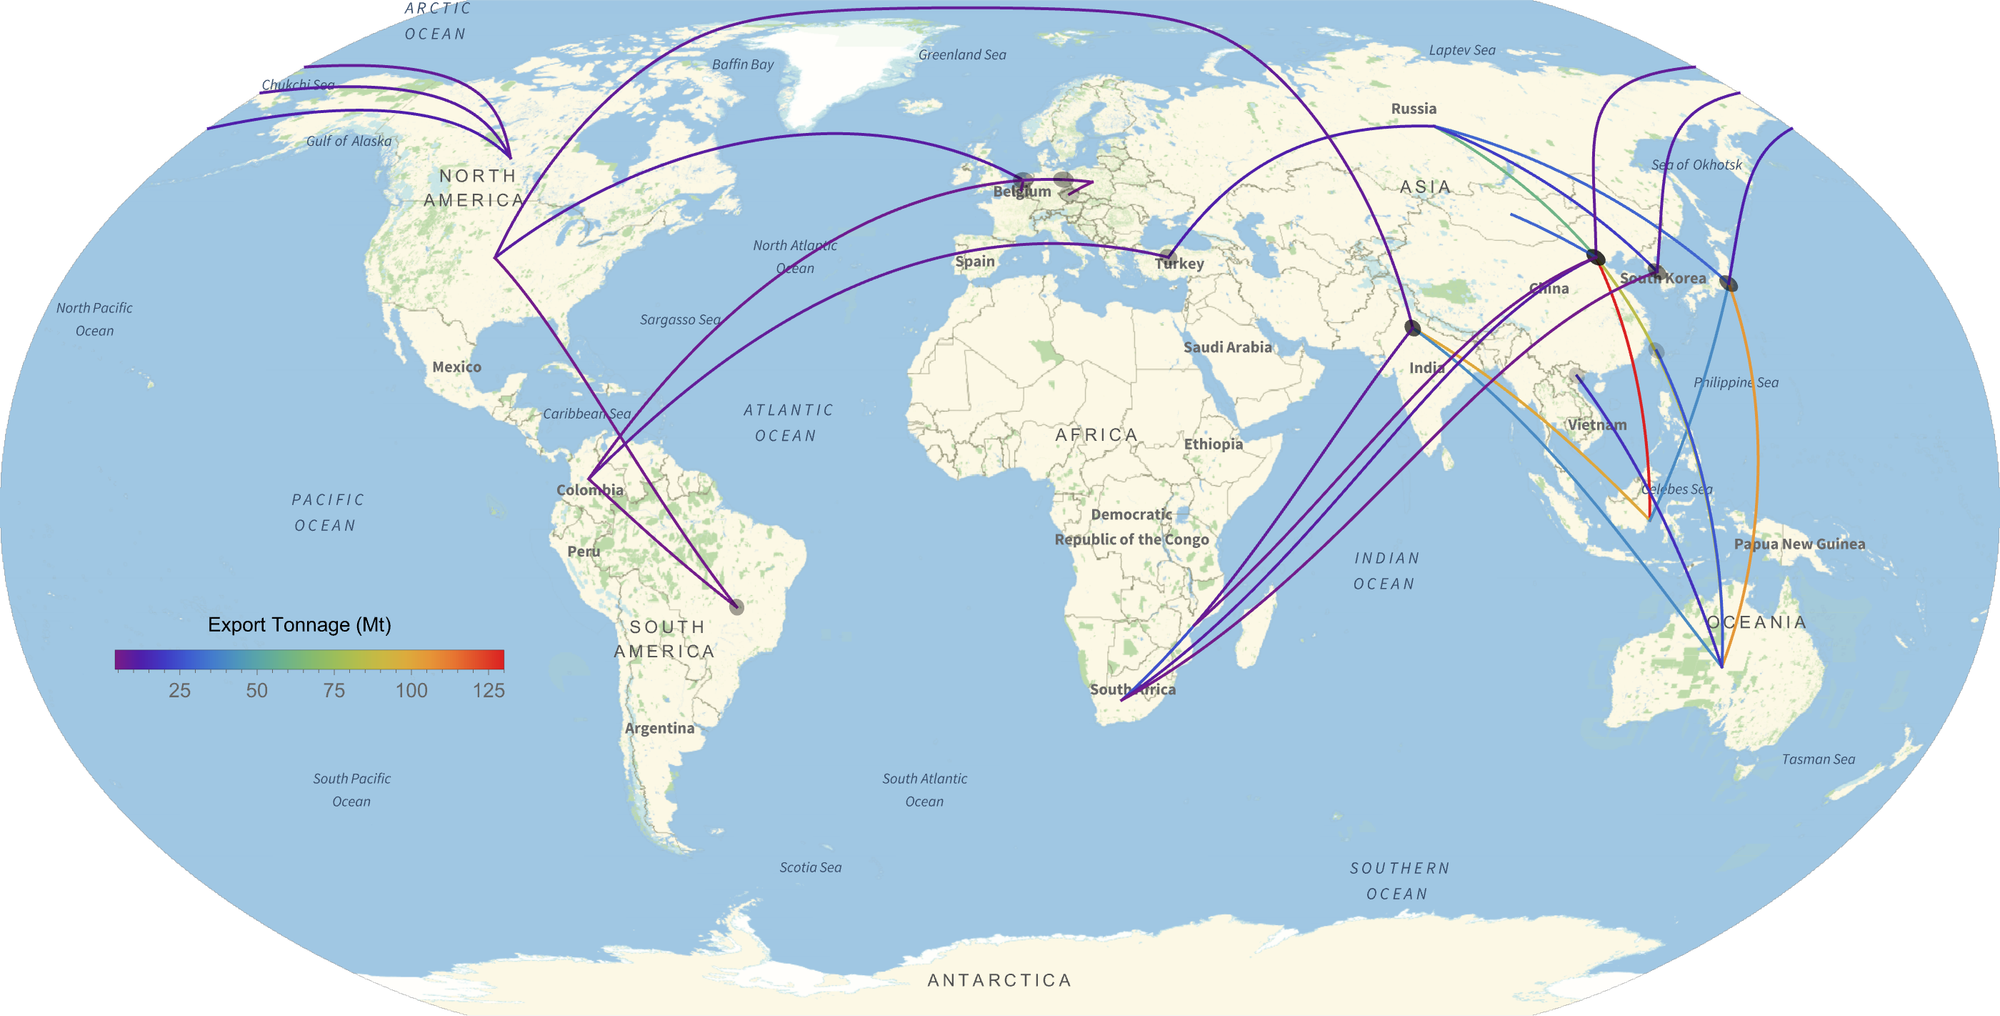
The trading map in Figure 2 uses these numbers as inputs:
| Exporter | Customer | Annual Tonnage (Mt, approx.) |
|---|---|---|
| Indonesia | China | 130 |
| Indonesia | India | 100 |
| Indonesia | Japan | 40 |
| Australia | Japan | 105.3 |
| Australia | China | 84.8 |
| Australia | India | 40.3 |
| Australia | Taiwan | 26.8 |
| Australia | Vietnam | 17.1 |
| Russia | China | 60 |
| Russia | Japan | 30 |
| Russia | South Korea | 20 |
| Russia | Turkey | 12 |
| United States | Netherlands | 10 |
| United States | India | 8 |
| United States | Brazil | 5 |
| South Africa | India | 25 |
| South Africa | China | 10 |
| South Africa | South Korea | 5 |
| Colombia | Turkey | 8 |
| Colombia | Netherlands | 6 |
| Colombia | Brazil | 5 |
| Canada | Japan | 12 |
| Canada | South Korea | 10 |
| Canada | China | 8 |
| Mongolia | China | 30 |
| Netherlands | Germany | 8 |
| Netherlands | Belgium | 6 |
| Mozambique | India | 8 |
| Mozambique | China | 6 |
| Poland | Germany | 6 |
| Poland | Czech Republic | 4 |
This list represents over 90% of global coal trading.4
Who is held responsible for the emissions of traded coal? Commonly, two types of tracking are used:5,6
- Production-based tracking, in which the customer country that burns the coal is considered the polluter
- Consumption-based tracking, in which the country in which the final product (created by the coal) is consumed is responsible
So, by way of example, to track by production: if Canada sells coal to Korea, and Korea uses it to make steel, then the emissions are attributed to Korea, because they burned the coal. But if we use consumption-based tracking, when Korea turns the steel into a flashy Hyundai Ioniq 6, which it sells to an Irish consumer, then the emissions are attributed to Ireland.
These methods of carbon accounting (applied for most types of fossil fuel sales) are certainly accurate, but they tend to mask the relationship of the vendor nation or company to the emitted carbon: the vendors have extracted, sold for profit, and shipped the fossil fuel that emits the carbon. They do everything except "light the match"...and they do so for profit, in the case of coal, from sales of one of the dirtiest fuels around.
Glowing embers (the bright side)
The failure to hold companies at the originating end of high-carbon-emission product chains is no secret. Which is good, because it absolutely must be considered as the world grapples with the magnitude and rapidity of carbon mitigation yet to come.7
As you study the coal market (and who could resist?), you'll come across what may be early indicators of the demise of coal in general and the global coal market in particular.
The world coal market may be softening
Even though the world coal market is highly variable regionally and is filled with nuance, it may be softening. Even though global coal consumption was at an all-time high in 2024, both China and India are attempting to focus on domestic production, while developed nations generally have strongly turned away from coal. EU coal generation fell at least 12% in 2024.2,10 The World Bank notes a 20% decline in coal prices in 2024 and predicts a 12% drop in each of 2025 and 2026.9 Eventually, such declines may have the ability to take marginal, export-focused coal mining operations offline.
Renewables are on the rise
China, the world's largest coal producer, consumer, and importer, has been working diligently to reduce its need for coal, even though coal is still central to its energy security and China is still bringing new coal plants online.
Analysts expect China's coal imports to decline as domestic coal production is able to meet needs. This has the potential to lower the global price of coal.
The use of coal in Europe is dropping steeply. Britain has closed its last coal-fired power plant.
A lower coal price could have two follow-on effects: coal may become more economical, which could extend its usage and the life of some coal-fired power plants, but it also could cause marginal coal mines to fail, and perhaps to be shut down.
Carbon capture and storage
You should be quite skeptical of carbon capture and storage promises. We certainly are.
But, even so, a few owners of coal-powered power plants have attempted to capture 90% or greater of emitted carbon dioxide. Notably, two plants—the Boundary Dam Carbon Capture Project in Canada and the Petra Nova plant in the US—have attempted CCS on emissions that emerge from their plants. Neither has yet met the commonly-cited goal of sustained 90% carbon capture from the full emissions stream of an operating utilities-scale coal plant.11, 12
But CCS efforts will continue, given growing pressure from emissions regulations in many nations. Even if coal-power CCS succeeds, though, it may still create problems, since it can prolong the life of a fuel that belongs to the early industrial revolution, but not in a future world where emissions must be controlled carefully. But, perhaps, even if coal plant carbon-capture and storage don't fully succeed, the expectation that coal plants must be clean may be helpful.
A requirement for coal plants to capture their carbon can only make coal plants—especially the older, dirtier ones—more expensive. If this happens, the cost advantages of wind and solar will be even more dramatic.
This, unquestionably, is as it should be: when the actual cost of released fossil fuel atmospheric carbon is taken into account, many industries—not just coal plants—are very difficult to cost-justify, even when social costs of carbon are not included.8, 9, 10
Reading
- If you look at a periodic table, you'll see that carbon has a mass of 12, while oxygen has a mass of 16. So, CO2 will have a mass of 1 carbon plus 2 oxygens, or 12 +16 +16. These are the atomic mass numbers, usually in small print below the atomic symbols. Don't confuse these with the atomic number (usually at the top left for each element), which is the count of the number of protons in an atom. If coal were pure carbon, you'd get 44/12 times the number of tonnes of coal, but in the real world, impurities mean a tonne of coal yields about 2.5 (or so) tonnes of CO2.
- IEA. “Trade – Coal 2024 – Analysis.” Accessed May 26, 2025. https://www.iea.org/reports/coal-2024/trade.
- Average human breathes about 0.5 liters per breath, roughly 12 breaths per minute → ~8.6 m³ per day per person.World population ~8 billion → ~6.9 × 10¹⁰ m³ breathed daily. The CO₂ volume equals about 29 days of total human breathing volume worldwide. https://en.wikipedia.org/wiki/Lung_volumes_and_capacities
- “World Top 10 Coal Exporters: Coal Exports Data 2024-25.” Accessed June 3, 2025. https://www.exportimportdata.in/blogs/top-coal-exporters.aspx.
- Intergovernmental Panel on Climate Change (IPCC). Climate Change 2014: Mitigation of Climate Change. Contribution of Working Group III to the Fifth Assessment Report of the Intergovernmental Panel on Climate Change. Annex I: Glossary, 1255–1264. Cambridge: Cambridge University Press, 2014. https://www.ipcc.ch/site/assets/uploads/2018/02/ipcc_wg3_ar5_annex-i.pdf.
- Davis, Steven J., and Ken Caldeira. "Consumption-Based Accounting of CO₂ Emissions." Proceedings of the National Academy of Sciences 107, no. 12 (2010): 5687–5692. https://www.pnas.org/doi/10.1073/pnas.0906974107
- International Energy Agency (IEA). World Energy Outlook 2023. Paris: IEA, 2023. https://www.iea.org/reports/world-energy-outlook-2023.
- Lazard. Levelized Cost of Energy+, Levelized Cost of Storage+, and Levelized Cost of Hydrogen+ 2023. New York: Lazard, April 2023. https://www.lazard.com/research-insights/2023-levelized-cost-of-energyplus/
- World Bank Blogs. “International Coal Price: Higher-for-Longer.” Accessed May 30, 2025. https://blogs.worldbank.org/en/opendata/international-coal-price--higher-for-longer.
- IEA. “Executive Summary – Coal 2024 – Analysis.” Accessed May 30, 2025. https://www.iea.org/reports/coal-2024/executive-summary.
- SaskPower. "Boundary Dam Carbon Capture Project." Last modified May 2, 2025. https://www.saskpower.com/our-power-future/infrastructure-projects/carbon-capture-and-storage/boundary-dam-carbon-capture-project.
International Energy Agency Greenhouse Gas R&D Programme (IEAGHG). W.A. Parish Post-Combustion CO₂ Capture and Sequestration Demonstration Project: DOE Final Technical Report Summary. Insight Paper 2020-IP11. March 2020. https://publications.ieaghg.org/insightpapers/2020-IP11 DOE report on Petra Nova.pdf.