O hauling night
Do you recall the most energy-intensive task of them all?

Our daily activities can sometimes seem miraculous: multi-tonne transport vessels hurtle through the air at the speed of sound, a big slice of human knowledge is freely available to everyone, synchronous global communications are easy and near-instantaneous, and a global marketplace is simple to set up for almost every product. (Oh, and newsletters that provide sudden illumination are free and come out weekly. Don't forget to subscribe.)
These tasks are unbelievably energy-intensive, especially when compared with their pre-industrial analogs. And with that energy expenditure comes a hefty greenhouse-gas footprint.
But do you recall the most energy-intensive task of them all?
Typically, when we look at animals and greenhouse gases, we're mostly concerned with methane and nitrous oxide emissions, since the carbon dioxide they breathe out has just been converted from plant-emitted oxygen, and will be converted back again by the plants in a timely fashion. The oxygen-to-CO2-to-oxygen cycle can be considered closed.
Just for today — just for reindeer — we're going to look at methane only (for a quick overview of all the other greenhouse gases, see Meet the in-laws). Tonne-for-tonne, methane is a much worse greenhouse gas than CO2 (fortunately it's less common).
As ruminants go, reindeer are anti-methane warriors. Yes, reindeer DO emit methane. Just like cattle, they are true ruminants with four stomachs. But reindeer are little. An average adult male reindeer tops out at 250 kilograms,1 while a typical Hereford bull can mass about 1,000 kilograms.2 Just going by mass alone, reindeer should be about four times more efficient.
But the real picture is way better. Reindeer will blow you away (but not with methane).
Cattle are given rich, energy-intense, high-fibre feeds like hay, ground grains, and silage. This diet makes them gain weight and produce milk and meat like crazy. Of course you know that all this rich food and the digestive microbial communities in their stomachs have the expected effects. Think of your embarrassing Uncle Tony after Christmas dinner.
The average beef or dairy animal can burp roughly .33 kilograms of methane a day. Just so you know, that's a lot: about 500 litres. Think of the volume of roughly 120 buckets of fried chicken.
The reindeer, on the other hand, eat very lean. They seem to like dry arctic lichen, which makes a conspicuous difference in their methane emissions. A reindeer will only emit about 1/30 the amount of methane a cow does, or .011 kilograms of methane per day.3 (Uncle Tony will NOT consent to eat "Dry Arctic Lichen Cereal", which we are pretty sure proves our point.)
The number of deliveries: The world's full of kids: about 2 billion under the age of 15.4 Since the average birthrate is about 2.2 kids per family, we can assume 909,090,909 or roughly a billion residential deliveries.5
The load: In our baseline analysis, we assumed the median requirement was for a delivery of a single one-kilogram package to each child in the world. A one-kilo present may seem a bit heavy, but these days, batteries can add a lot to the load. And remember, very few kids ask for yo-yos or Hot Wheels cars, but a truly shocking number ask for ponies. Consequently, the load's going to be heavy: 2,000,000,000 (two billion) kilograms.
The distances: The median human being lives about 10,000 kilometers from the North Pole.6 Fortunately, people cluster in neighbourhoods where the median distance between residences is about 50 meters.7 Happily, this adds a lot of delivery efficiency. Santa's route will, of necessity, be a blend of great-circle travel and door-to-door hopping.
The lowest possible distance is when Santa can make a single trip (if his sack is up to it). The trip length is approximately the median residential separation times the number of deliveries, or roughly 1 billion times 50 meters, plus two-way travel of the median distance from Santa's house to the average human house. That's more-or-less 1/3 the distance from the Earth to the Sun, or 50,000,000 kilometers.
The greatest possible distance would be if Santa made a single trip for each residence, or 10,000 kilometers times 1 billion deliveries. That's roughly 1.057 light years, or 9,900,000,000,000 kilometers. The brighter readers will immediately notice the speed in this longer trip is 365.3 times the speed of light: the same number of days in our calendar year.8 Obviously, magical reindeer have no problem with the paltry limits of Einsteinian physics, so they can violate the light-speed limit. We can assume the implied velocity (1 light-year in 24 hours) is entirely possible. It's not logistically optimal, though; we regard the 50,000,000 kilometer solution as closer to reality than the 1.057 light year solution. Quelle surprise.
So, 50 million kilometers in 24 hours. That's 2,083,333 kilometers/hour. Remember: the sleigh has to wait for Santa as he adjusts the width of something to go down and up chimneys, delivers toys, sedates dogs, kisses selected Mommies (ewww), and figures out how to get into houses that have electric subfloor heating and no fireplaces. Consequently, the actual between-kids-velocity is likely much, much higher. (See "Unresolved cartage capacity methodology", below.)
Not included in our baseline analysis:
Allowance for naughty children: First off, we can't — under any scenario — advocate for delivery of big lumps of coal to children. Giving out quantum death-rays would be safer, at least within a greenhouse-gas-footprint risk-analysis. So everybody — naughty or nice — is going to get an actual gift. Not coal. Not on our watch.
For greater depth of analysis, naughty children seem to raise the mass of the median delivery task, since we observe a strong correlation between number and size of gifts and naughty behaviour. Bad kids get more stuff. But we're not sure if the excessive gifts cause the behaviour or the behaviour threatens the parents into giving more gifts. More research is required here, but we don't expect it to shift the footprint calculations.
Allowance for multiple gifts: This won't change the route, but it also increases the mass transported. And it threatens world peace because greedy kids become greedy adults. We're looking at you, Putin.
Exploration of energy sources: The sleigh expends a LOT of energy in a very short time. If it's truly technology (as opposed to truly magic), we estimate that the conversion of a single-day's ration of arctic lichen directly to energy (likely through antimatter injections moderated by dilithium crystals) is about right. We hypothesize a fifth stomach in the reindeer, which we will provisionally call the Pylorus Brumalia (valve for holiday partying) that enables operation of an antimatter/lichen energy chamber in an adjacent dimension. Note, please, that this is likely a mammalian trait, since Santa must have one too. He has to do something with all the cookies, milk and (frankly) rum he ingests in each kitchen.
Unresolved cartage capacity methodology: How the heck does Santa put all that stuff in his sack? He certainly could make many trips (as we have seen irrefutably demonstrated above) with a normal sack (say 20 litres at a time), but given the astonishing tech in the sleigh, we're betting on some form of Transdimensional Engineering to enable the logistically-superior 50,000,000 kilometer run.9

Put simply, the only reasonable technology solution to the cartage capacity problem is: the sack is bigger on the inside.
A handy way to compare the emissions of different ways of moving stuff around is to use a "freight emissions factor" chart. The US EPA does a great job of compiling these at its GHG Emission Factors Hub.10 Methane efficiency is measured grams of methane per tonne-kilometer.
This only SOUNDS bad. It simply answers the question: if I move one metric tonne one kilometer, how much methane do I get?
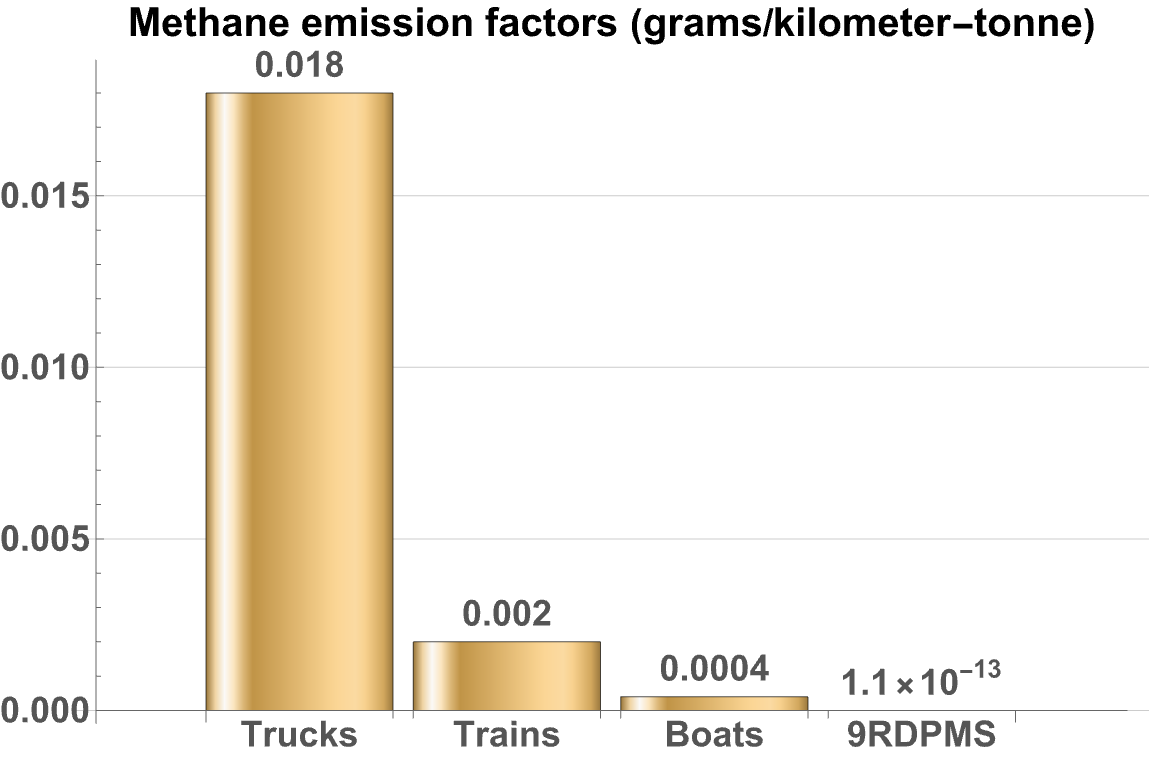
After a little bit of arithmetic, we were able to use the estimates above to create a modified mini-version of the methane column of the EPA's table, with "9RDPMS" (Nine ReinDeer Propelled Magic Sleigh) included.
In this table, smaller numbers are better.
| Type | Methane emitted (grams/kilometer-tonne) |
|---|---|
| Trucks | 0.018 |
| Trains | 0.0020 |
| Boats | 0.0004 |
| 9RDPMS | 0.00000000000011 |
Or, as a bar chart:

Run, Rudolph. Run!11
Go hug somebody.
Reading
- The British Deer Society. “Reindeer - Species Information.” Accessed December 24, 2024. https://bds.org.uk/information-advice/about-deer/deer-species/reindeer/.
- Firdaus F, Atmoko BA, Baliarti E, Widi TSM, Maharani D, Panjono P. The meta-analysis of beef cattle body weight prediction using body measurement approach with breed, sex, and age categories. J Adv Vet Anim Res. 2023 Dec 31;10(4):630-638. doi: 10.5455/javar.2023.j718. PMID: 38370885; PMCID: PMC10868685.
- Hansen, Kia Krarup, Monica Alterskjær Sundset, Lars P. Folkow, Marte Nilsen, and Svein D. Mathiesen. “Methane Emissions Are Lower from Reindeer Fed Lichens Compared to a Concentrate Feed.” Polar Research, October 19, 2018. https://polarresearch.net/index.php/polar/article/view/2644.
- Population Reference Bureau. 2024. "Highlights From the 2024 World Population Data Sheet." PRB, September 16, 2024. https://www.prb.org/articles/highlights-from-the-2024-world-population-data-sheet/.
- Singhania, Aarushi, and Neil Allison. "Mapped: The World's Population Density by Latitude." World Economic Forum, December 24, 2024. https://www.weforum.org/stories/2022/05/mapped-the-world-s-population-density-by-latitude/.
- The Lancet: Dramatic Declines in Global Fertility Rates Set to Transform Global Population Patterns by 2100 | Institute for Health Metrics and Evaluation.” Accessed December 24, 2024. https://www.healthdata.org/news-events/newsroom/news-releases/lancet-dramatic-declines-global-fertility-rates-set-transform.
- Shah, Angelina. "How Average Home Sizes Vary Around the World." The Swaddle, December 24, 2024. https://www.theswaddle.com/how-average-home-sizes-vary-around-the-world.
- You cannot convince us that this is a coincidence. Somebody Insta Alex Jones, would you please?
- Yeah, like the Tardis. See https://www.reddit.com/r/doctorwho/comments/16r9043/how_does_the_tardis_work/.
- US EPA, OAR. “GHG Emission Factors Hub.” Overviews and Factsheets, July 27, 2015. https://www.epa.gov/climateleadership/ghg-emission-factors-hub.
- This is more Barry Allen than Chuck Berry.
