How Not To Be a Boiled Frog
Blink.

We love frogs! Not fricasseed or fried, and especially not boiled. Especially not boiled alive (we're saying that up front). We like 'em free and happy on leaves in the garden, or singing their little hearts out in the lake at dusk. They make us feel good, not the least because they are still here.
If we were to start to warm up that lake, the frogs—who generally have a lot more common sense than people who like hot tubs—would leave the water pretty quickly. They do not readily tolerate excess heat.1
You almost certainly have heard the boiled frog story: "If you put a frog in a pot of cold water and raise the heat slowly, the frog won't notice and will stay in the water until it boils."
Of course, the story is not correct. But it does persist.
Climate and ecology watchers know plenty of other stories like this: stories where the boiled frog metaphor is apt.
Here's just one.
In a 97-foot caravel with a crew of only 19, John Cabot (Giovanni Caboto, an actual Merchant of Venice) arrived off the coast of Newfoundland in 1497. To get there, he crossed the Grand Banks. This fog-bound, current-ridden extension of the continental shelf forms an underwater plateau with an area a little larger than the United Kingdom. And did it have fish! The cod off the coast of Newfoundland, in the Grand Banks and adjacent areas, were so abundant that Cabot is said to have remarked that the offshore areas were "swarming with fish, which can be taken not only with the net, but in baskets let down with a stone."2 Nets, baskets, sonar, factory-freeze trawlers, and every possible fishing invention pulled millions of tonnes of cod out of the northern cod fishery over centuries.3 By 1992, cod biomass had fallen to less than 1% of its natural, homeostatic levels.4 John Crosbie, Canada's then-Minister of Fisheries and Oceans, called a moratorium on commercial cod fishing, but it was too late. The cod population crashed catastrophically. Thirty thousand people lost their jobs.5 (Take a moment to watch the seething confrontation between Crosbie and fisher families: see footnote 5.)
Among researchers (and people who are generally unhappy with inaccurate frog-based metaphors), this reticence to react is usually referred to as "the shifting baseline effect". Nobody remembers what the Atlantic cod stocks looked like in 1497. People in 1982 remembered the cod stocks from 1979 or 1977. People in 1988 remembered the cod stocks from 1982. Recent memories form the basis for our judgements. Our baseline shifts, travelling through time with us.7
The term "baseline shift" was introduced in a paper about—how could you guess?—fisheries management.4 But you can find shifting baselines all over the place, once you look: bison populations and passenger pigeons in North America,7 shifts in global temperature, the increasing frequency and severity of wildfires, changes in Pacific reefs,8 the changing waist sizes of your pants over a few decades, the mole on your neck that, when you look back at your wedding photo, was just a tiny thing, but now....
The shifting baseline phenomenon is well known to policy makers and advocates: if people don't think something is wrong, why would they support change?
Lived experience can feel like a steady state, even when empirical measurement shows steady change. Steady change itself can seem like no big deal, especially when the changes are small within the frame of human memory.
Nobody is surprised to hear this, of course. It's just common sense...but so is the converse, which occurs when the intermediary states are hidden in some way.
Your pants are always your pants, but for the sake of your self-respect, don't attempt those 30-year-old leather jeans in the back of your closet.
This is why the stone angels in the Doctor Who episode "Blink" are so frightening (no, they don't have leather pants: stay focused). When you see the stone angels at first, they are at a distance, and appear to be normal statues. But when the room is dark or when you close your eyes, the angels change. When you see them again, they are suddenly in a vastly different state: close up, threatening, and fierce. Steven Moffat's stone angels are the perfect metaphor for the converse effect to the baseline shift...and so well done that Blink won a Hugo award in 2008.
To astronomers, this is an old trick. Want to find an Earth-threatening asteroid so you can name it after your girlfriend or perhaps Liv Tyler? Use a "blink comparator."
Take a picture of the sky. Wait. Take another picture of the sky. Align the images. Flip back and forth between them. Does something move? Is something in one shot but not in the other? Maybe it's an asteroid. Maybe you should call Bruce Willis.
If you pay attention to ecology and the environment, you can think of plenty of examples where the sampling is far enough apart for "sudden" changes to be noticeable: glacier retreat photography,15, 16 deforestation monitoring,17 the death of outdoor skating rinks on the prairies in North America,18 and changes in Arctic sea ice.19
If you consider how these examples are often presented, you'll notice some techniques that work well to help "unhide" changes buried by shifting baselines:
- Use visual data
- Apply time-series analyses to reveal long-term changes
- Take bigger samples or average over longer times to help changes stand out (use "blocks" rather than continuous measurements)
- Compare measurements separated by significant intervals
- Zoom in as close as you can to the data so you can see the differences (eliminate irrelevant scaling)
This is why you'll usually see global warming presented as a measurement of temperature anomaly (which shows quite significant differences over time: 1.5o C shows up readily) rather than as measurements of yearly temperature averages (the difference between 15o and 16.5o C is hard to notice). The latter tends to hide temperature changes in the same way lived experience hides them.
As a case study, the authors present a scatter plot of historical (and fictional) lake temperatures. It doesn't show much change at all. But the authors also offer a scatter plot of whether or not a lake froze in the same range of years. This second plot shows a palpable difference across the timescale. It matches a dramatic and perceptible change in lived experience: which years allowed you to skate?
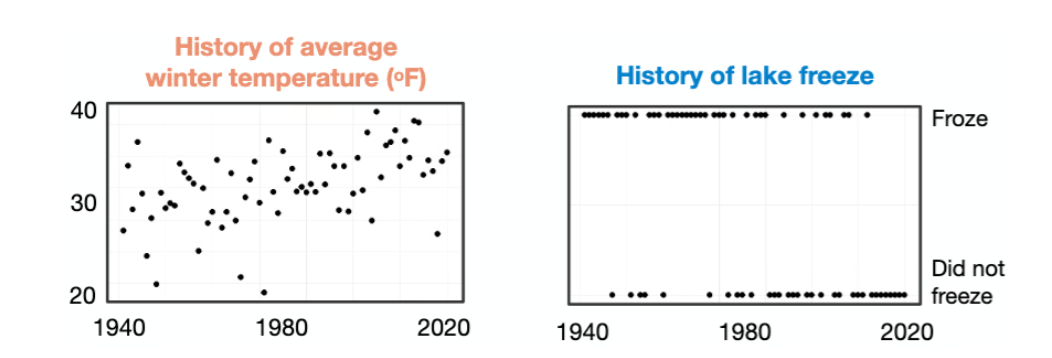
The authors used this sample data to conduct large-scale cognitive studies to compare the effects of these styles of presentation. The binary data (frozen vs. not frozen) created a much-more-dramatic sense of change and urgency than the commonly-used time-based winter temperature measurements.
If you have time, read the open-access summary referenced in our footnote 21. The authors have developed a great technique to highlight change and to relate it to human experience. It presents critical information in the same way that the stone angels in Blink moved.
Although this technique can be applied across many different fields, it has the potential to make an important difference in our approach to climate change. In election after election, budget after budget, western democracies tend to ignore needed climate policies in favour of issues that are much less urgent and less existential.
Reading
- Just search for "boiling frog legend". Tons of stuff to read on this, a lot of it filled with conspicuous cruelty and a paucity of common sense.
- “John Cabot.” Accessed June 6, 2025. https://www.thecanadianencyclopedia.ca/en/article/john-cabot.
- Hayes, Patrick, Poul Holm, and John Nicholls. “500 Years of the Once Largest Fishery in the World: A Comprehensive Catch Reconstruction for the Newfoundland Cod Fishery (1508–2023).” Fisheries Research 285 (May 1, 2025): 107325. https://doi.org/10.1016/j.fishres.2025.107325.
- Pauly, Daniel. “Anecdotes and the Shifting Baseline Syndrome of Fisheries.” Trends in Ecology & Evolution 10, no. 10 (October 1995): 430. https://doi.org/10.1016/S0169-5347(00)89171-5.
- The End of the Cod - John Crosbie in Bay Bulls Canada Day 1992., 2013. https://www.youtube.com/watch?v=inDgw8AWmiw.
- Naddaf, Rachelle. “The Story of Cod and a Case for Rebuilding.” Oceana Canada (blog), November 21, 2022. https://oceana.ca/en/blog/the-story-of-cod-and-a-case-for-rebuilding/.
- Schijns, Rebecca, and Daniel Pauly. "Management Implications of Shifting Baselines in Fish Stock Assessments." Fish and Fisheries 22, no. 4 (2021): 755–766. https://doi.org/10.1111/fme.125
- “Shifting Baseline (U.S. National Park Service).” Accessed June 6, 2025. https://www.nps.gov/articles/000/shifting-baseline.htm.
- Muldrow, Milton, Edward C. M. Parsons, and Robert Jonas. “Shifting Baseline Syndrome among Coral Reef Scientists.” Humanities and Social Sciences Communications 7, no. 1 (July 20, 2020): 1–8. https://doi.org/10.1057/s41599-020-0526-0.
- Dayton, Paul K., Simon F. Thrush, Michael T. Agardy, and Rick J. Hofman. “Sliding Baselines, Ghosts, and Reduced Expectations in Kelp Forest Communities.” Ecological Applications 8, no. 2 (May 1998): 309–322. https://doi.org/10.1890/1051-0761(1998)008[0309:SBGARE]2.0.CO;2.
- McClenachan, Loren. “Documenting Loss of Large Trophy Fish from the Florida Keys with Historical Photographs.” Conservation Biology 23, no. 3 (June 2009): 636–643. https://doi.org/10.1111/j.1523-1739.2008.01152.x.
- Soga, Masashi, and Kevin J. Gaston. “Shifting Baseline Syndrome: Causes, Consequences, and Implications.” Frontiers in Ecology and the Environment 16, no. 4 (May 2018): 222–230. https://doi.org/10.1002/fee.1794.
- Papworth, Sarah K., J. Rist, L. Coad, and E.J. Milner-Gulland. “Evidence for Shifting Baseline Syndrome in Conservation.” Conservation Letters 2, no. 2 (April 2009): 93–100. https://doi.org/10.1111/j.1755-263X.2009.00049.x.
- Pinnegar, John K., and Trevor H. J. Shepherd. “Shifting Baseline Syndrome—An Intergenerational Perspective.” Trends in Ecology & Evolution 25, no. 10 (October 2010): 602. https://doi.org/10.1016/j.tree.2010.07.008.
- “Timelines Project Paints the Lines of Glacier Retreat – State of the Planet,” September 24, 2020. https://news.climate.columbia.edu/2020/09/24/timelines-project-glacier-retreat/.
- “Glacier Repeat Photos - Glacier National Park (U.S. National Park Service).” Accessed June 7, 2025. https://www.nps.gov/glac/learn/nature/glacier-repeat-photos.htm.
- Hansen, M.C., et al. 2013. “High-Resolution Global Maps of 21st-Century Forest Cover Change.” Science 342, no. 6160: 850–853. https://glad.earthengine.app/view/global-forest-change#bl=off;old=off;dl=1;lon=20;lat=10;zoom=3.
- “Canada’s Beloved Outdoor Ice Rinks Are Melting Away.” Accessed June 7, 2025. https://www.nationalgeographic.com/environment/article/skating-canadian-ice-rinks-warming-winters.
- Change, NASA Global Climate. “Arctic Sea Ice Minimum | NASA Global Climate Change.” Climate Change: Vital Signs of the Planet. Accessed June 7, 2025. https://climate.nasa.gov/vital-signs/arctic-sea-ice?intent=121.
- Liu, G., Snell, J.C., Griffiths, T.L. et al. Binary climate data visuals amplify perceived impact of climate change. Nat Hum Behav (2025). https://doi.org/10.1038/s41562-025-02183-9
- Nature, Research Communities by Springer. “Informing the Boiling Frog: Binary Climate Data Amplifies Climate Change Perception.” Research Communities by Springer Nature, April 17, 2025. https://communities.springernature.com/posts/informing-the-boiling-frog-binary-climate-data-amplifies-climate-change-perception.