Gassy knolls: Automation finds the 10 worst methane hotspots
A methane-hotspot tool uses satellite data to find problem regions. We need this tool — and others like it — to stop climate change.

That's the way you do it!
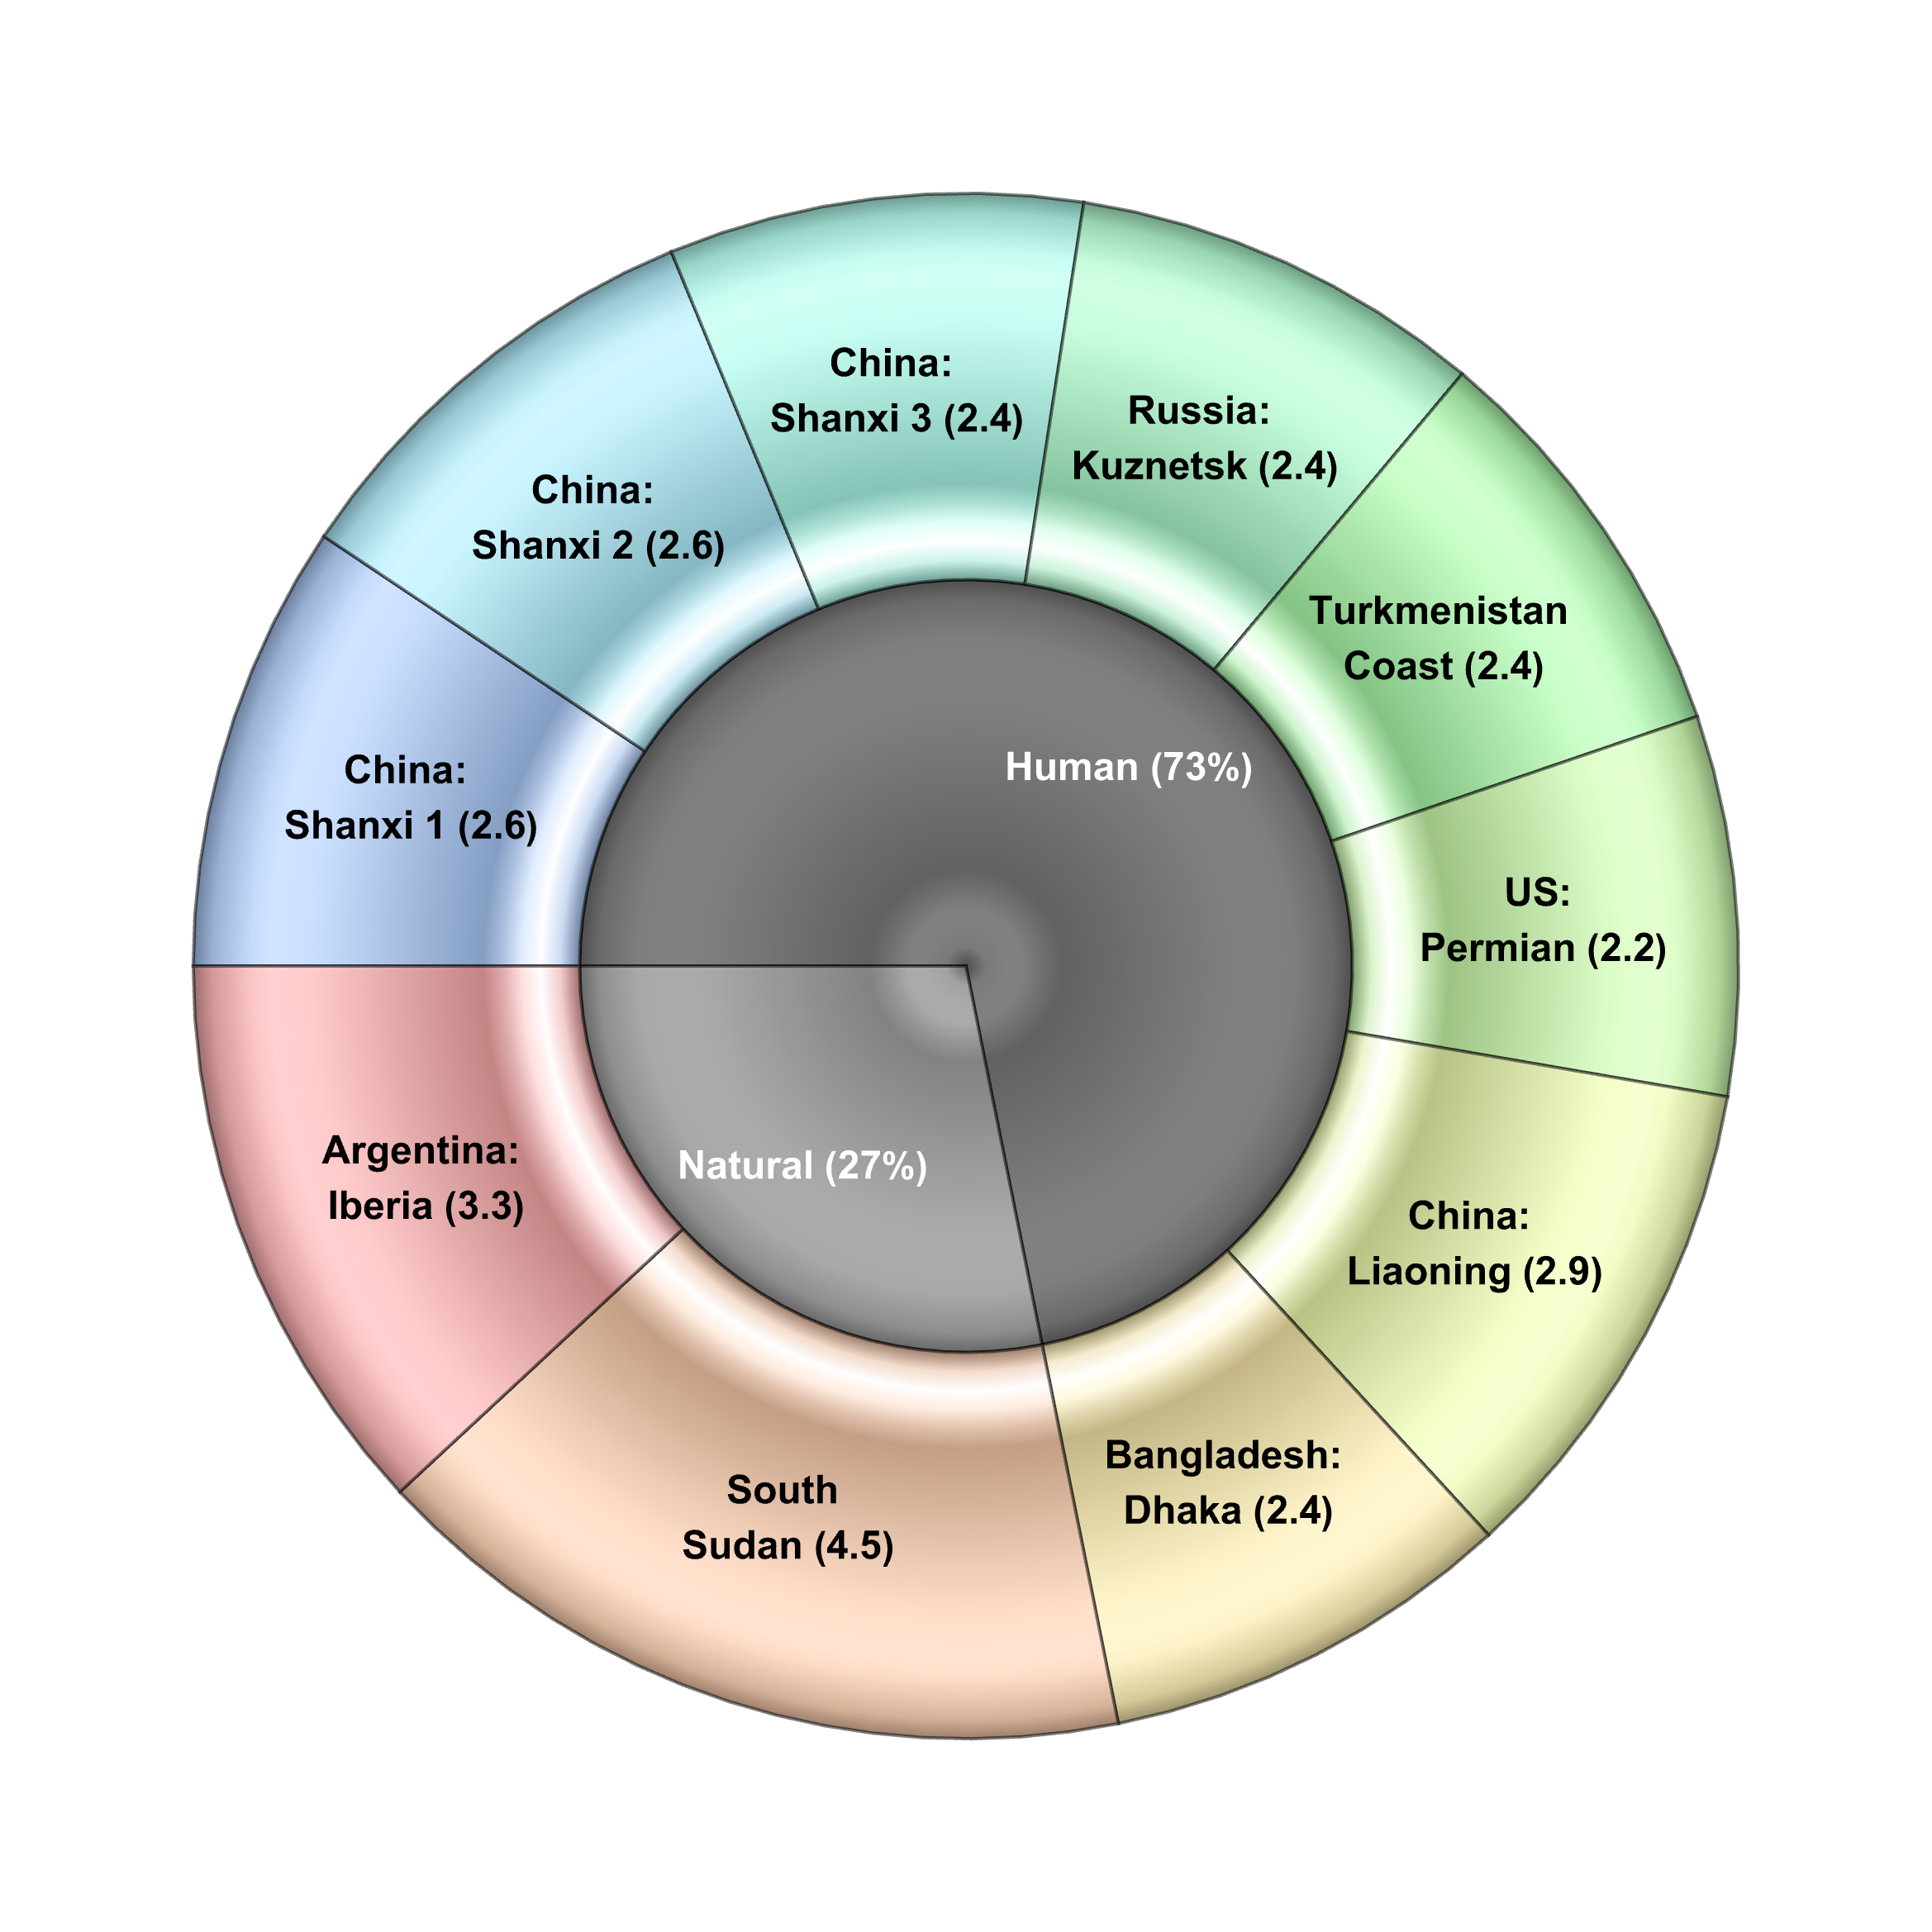
Based on Sentinel-5P data, seven researchers have created a machine-learning routine — using techniques associated with artificial intelligence — that found 217 persistent methane-emissions regions. To illustrate how useful this algorithm can be, they applied it to find the ten worst "persistent emissions" regions on the planet.
Here's what they found:

We'll talk a bit more about the arithmetic in a moment, but the take-away lessons from this example are important, too.
Greater detail reveals more about the sources:2,3,4
| Location | Value (Mt/year) | Type |
|---|---|---|
| China - Shanxi 1 | 2.6 | Coal |
| China - Shanxi 2 | 2.6 | Coal |
| China - Shanxi 3 | 2.4 | Coal |
| Russia - Kuznetsk | 2.4 | Coal |
| Turkmenistan Coast | 2.4 | Oil and Gas |
| US - Permian | 2.2 | Oil and Gas |
| China - Liaoning | 2.9 | Rice, coal, oil & gas |
| Bangladesh - Dhaka | 2.4 | City & area |
| South Sudan Sudd | 4.5 | Wetland |
| Argentina - Iberia | 3.3 | Wetland |
The polities governing many of these regions may make them resistant to remediation. Even so, some progress is evident:
- China's growth in solar and wind now produces power more cheaply than coal is able to
- Some oil and gas producers in the US understand — regardless of policies set by any particular US administration — the profits that can be made from methane recapture, and they are working to realize revenue lost through leaks5
- Turkmenistan has formally taken the Global Methane Pledge6 and has a plan of attack in place
The important part
The specific sites are, of course, important. But, in context, the sites are a small part of a big emissions picture that can now be produced by automation.
The Sentinel data was gathered from 2018 to 2021, and then turned into per-region annual emissions for comparison.1 Together, all these sources release about 28 megatonnes of methane a year. In 2021, total global methane emissions were about 580 megatonnes.7
This algorithm — and others like it — are rapid, automatic ways to find, isolate, and analyze methane-emitting hot spots that need attention. Some of these algorithms can evaluate individual plumes for spot-diagnosis of high-intensity emissions,8 while yet others can compare localized emissions to forecasts9 in a way that causes transient emissions to stand out like hot sasquatches on an ice rink.
Reading
- GAgency, European Space. “Satellite Data Analysis Uncovers Top 10 Persistent Methane Sources.” Accessed February 16, 2025. https://phys.org/news/2025-02-satellite-analysis-uncovers-persistent-methane.html.
- Vanselow, Steffen, Oliver Schneising, Michael Buchwitz, Maximilian Reuter, Heinrich Bovensmann, Hartmut Boesch, and John P. Burrows. “Automated Detection of Regions with Persistently Enhanced Methane Concentrations Using Sentinel-5 Precursor Satellite Data.” Atmospheric Chemistry and Physics 24, no. 18 (September 19, 2024): 10441–73. https://doi.org/10.5194/acp-24-10441-2024.
- Bloomberg.com. “Large Methane Plume Spotted Near China Natural Gas Pipeline.” November 9, 2021. https://www.bloomberg.com/news/articles/2021-11-09/plume-of-greenhouse-gas-methane-spotted-near-china-pipeline.
- Energy Connects. “Large Methane Plume Spotted Near China Natural Gas Pipeline,” September 11, 2021. https://www.energyconnects.com/news/gas-lng/2021/november/large-methane-plume-spotted-near-china-natural-gas-pipeline/.
- LeBlanc, Raoul. "Turning the Tide: Upstream Permian Methane Emissions Drop 26% in 2023." S&P Global Commodity Insights, November 15, 2024. https://www.spglobal.com/content/dam/spglobal/ci/en/documents/news-research/research/turning-the-tide-upstream-permian-methane-emissions-drop-26-percent-in-2023-november-2024.pdf.
- United Nations Framework Convention on Climate Change. "STATEMENT by the President of Turkmenistan at the 28th session of the Conference of the Parties to the UN Framework Convention on climate change." Dubai, UAE, December 1-2, 2023. https://unfccc.int/sites/default/files/resource/TURKMENISTAN_cop28cmp18cma5_HLS_ENG.pdf.
- IEA. “Methane and Climate Change – Global Methane Tracker 2022 – Analysis.” Accessed February 19, 2025. https://www.iea.org/reports/global-methane-tracker-2022/methane-and-climate-change.
- Lauvaux, T., C. Giron, M. Mazzolini, A. d’Aspremont, R. Duren, D. Cusworth, D. Shindell, and P. Ciais. “Global Assessment of Oil and Gas Methane Ultra-Emitters.” Science 375, no. 6580 (February 4, 2022): 557–61. https://doi.org/10.1126/science.abj4351.
- Barré, Jérôme, Ilse Aben, Anna Agustí-Panareda, Gianpaolo Balsamo, Nicolas Bousserez, Peter Dueben, Richard Engelen, et al. “Systematic Detection of Local CH4 Anomalies by Combining Satellite Measurements with High-Resolution Forecasts.” Atmospheric Chemistry and Physics 21, no. 6 (April 1, 2021): 5117–36. https://doi.org/10.5194/acp-21-5117-2021.
